Introduction
At GetInData, we understand the value of full observability across our application stacks.
In this article we will share with you our experience from running observability stacks on kubernetes hosted on public clouds and on premise environments. All presented with interesting use cases.
Continuous improvement
Each new implementation provides valuable experience which we use to improve the next one.
This allows us to continuously extend our stack to be more efficient, flexible and robust.
Implementations
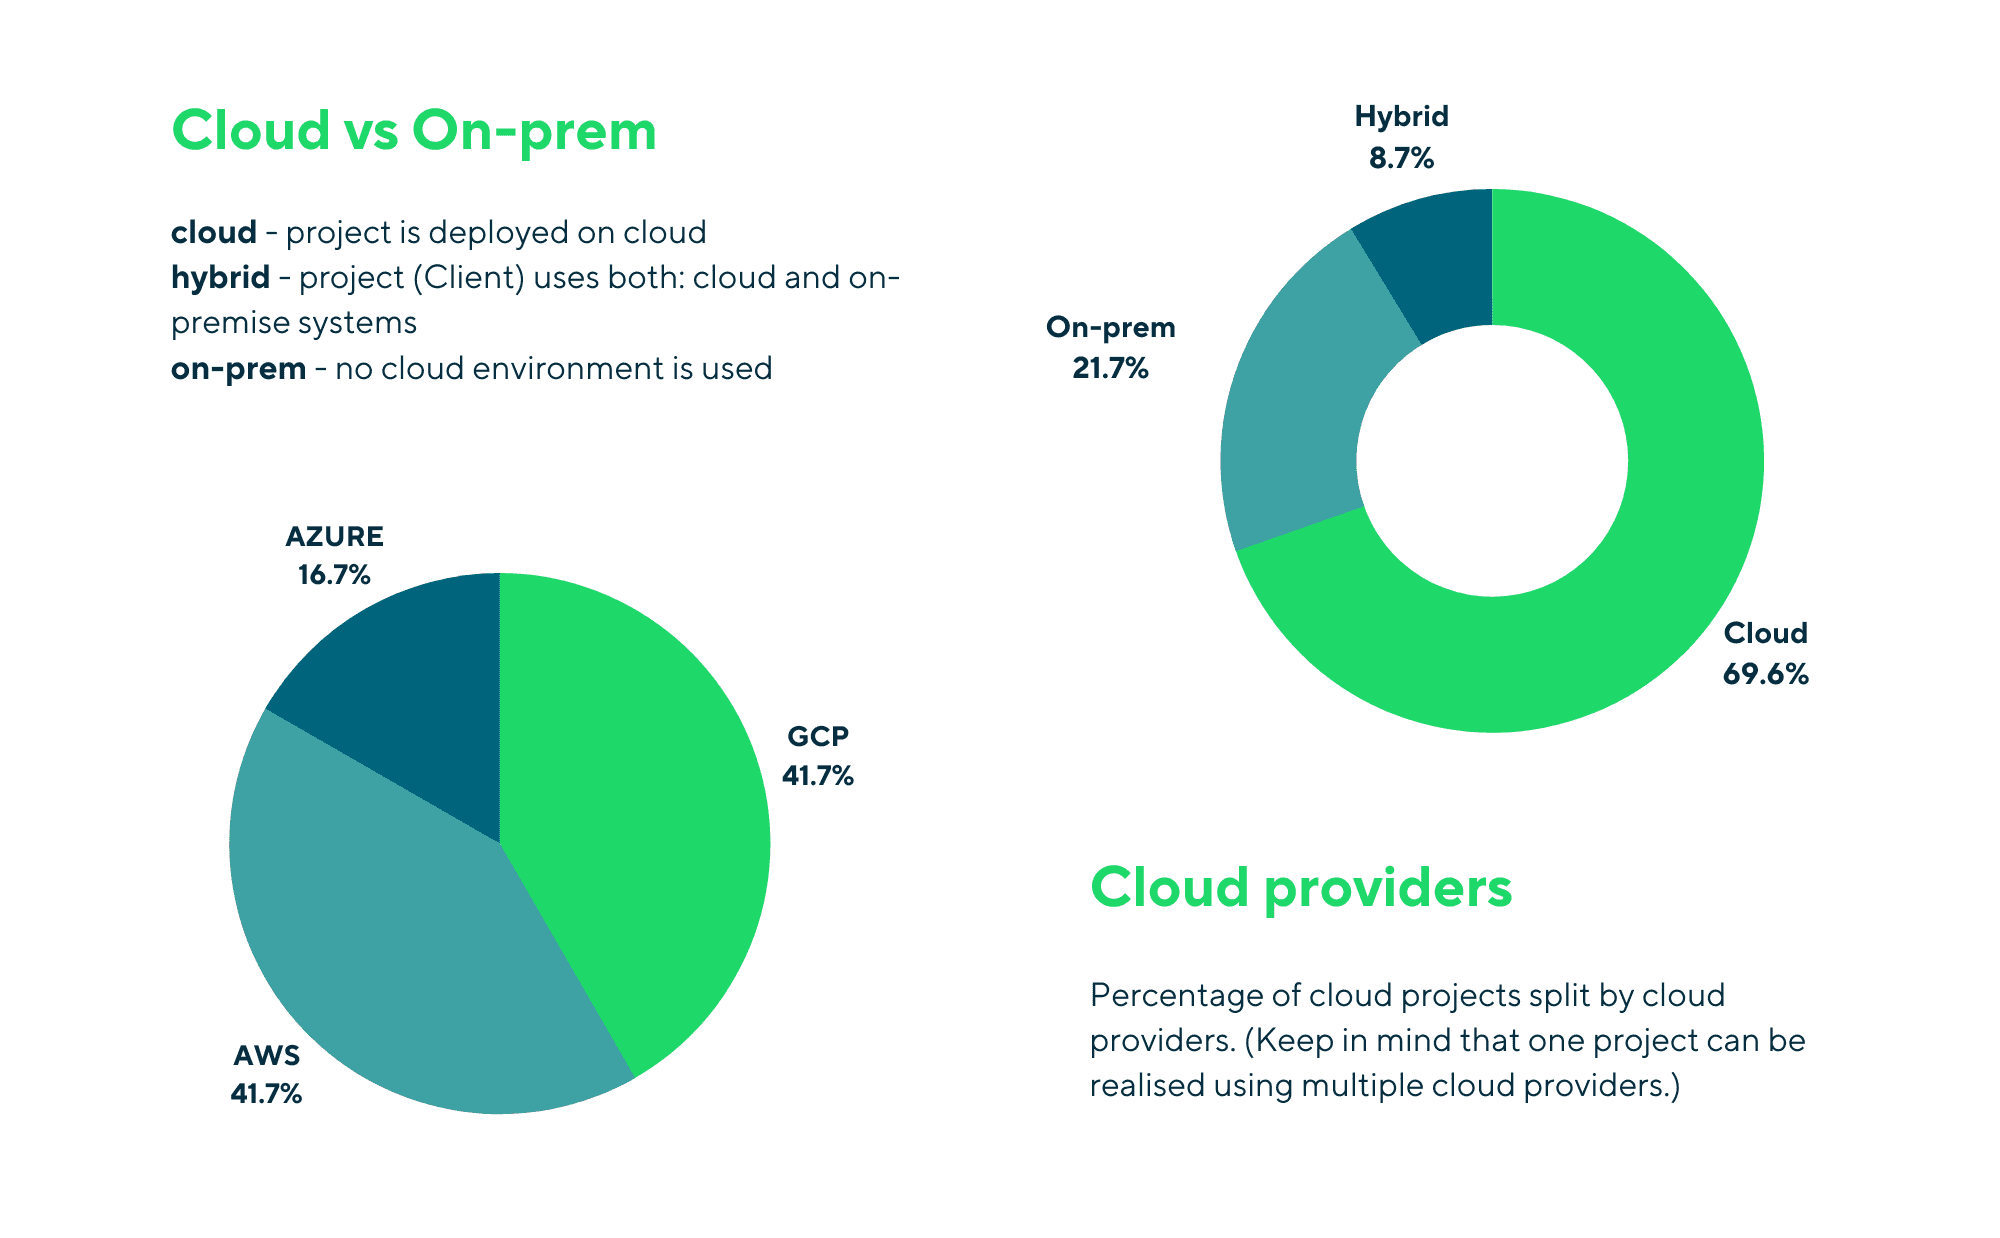
Currently, more than half of GetInData active projects are those where we manage observability stacks completely, meaning we design, implement and maintain the monitoring, logging and tracing of our application stacks:


Lessons learned
Now, let’s talk about some interesting use cases we have encountered along the way.
We will divide them into the following areas: deployment, operation and performance.
Deployment
How should you deploy your monitoring solution properly?
✅ Thanos for highly available multi-cluster prometheus deployments
A single pane of glass for all your prometheus deployments? Yes, it’s possible!
Thanos can integrate multiple prometheus instances without any additional components.
But there is more:
- it is 100% compatible with Prometheus API - no Grafana dashboards changes!
- it can provide unlimited retention of historical data with downsampling capabilities
- it supports all major object storage engines
✅ Choose reliable, feature reach tools able to support multiple architectures
But what does it mean exactly?
There are plenty of tools out there but as always, some of them are better than others.
Based on our experience, we recommend our version of LGTM stack:
- L for logging using Loki
- G for visualization using Grafana
- T for tracing using Tempo
- M for metrics using Prometheus
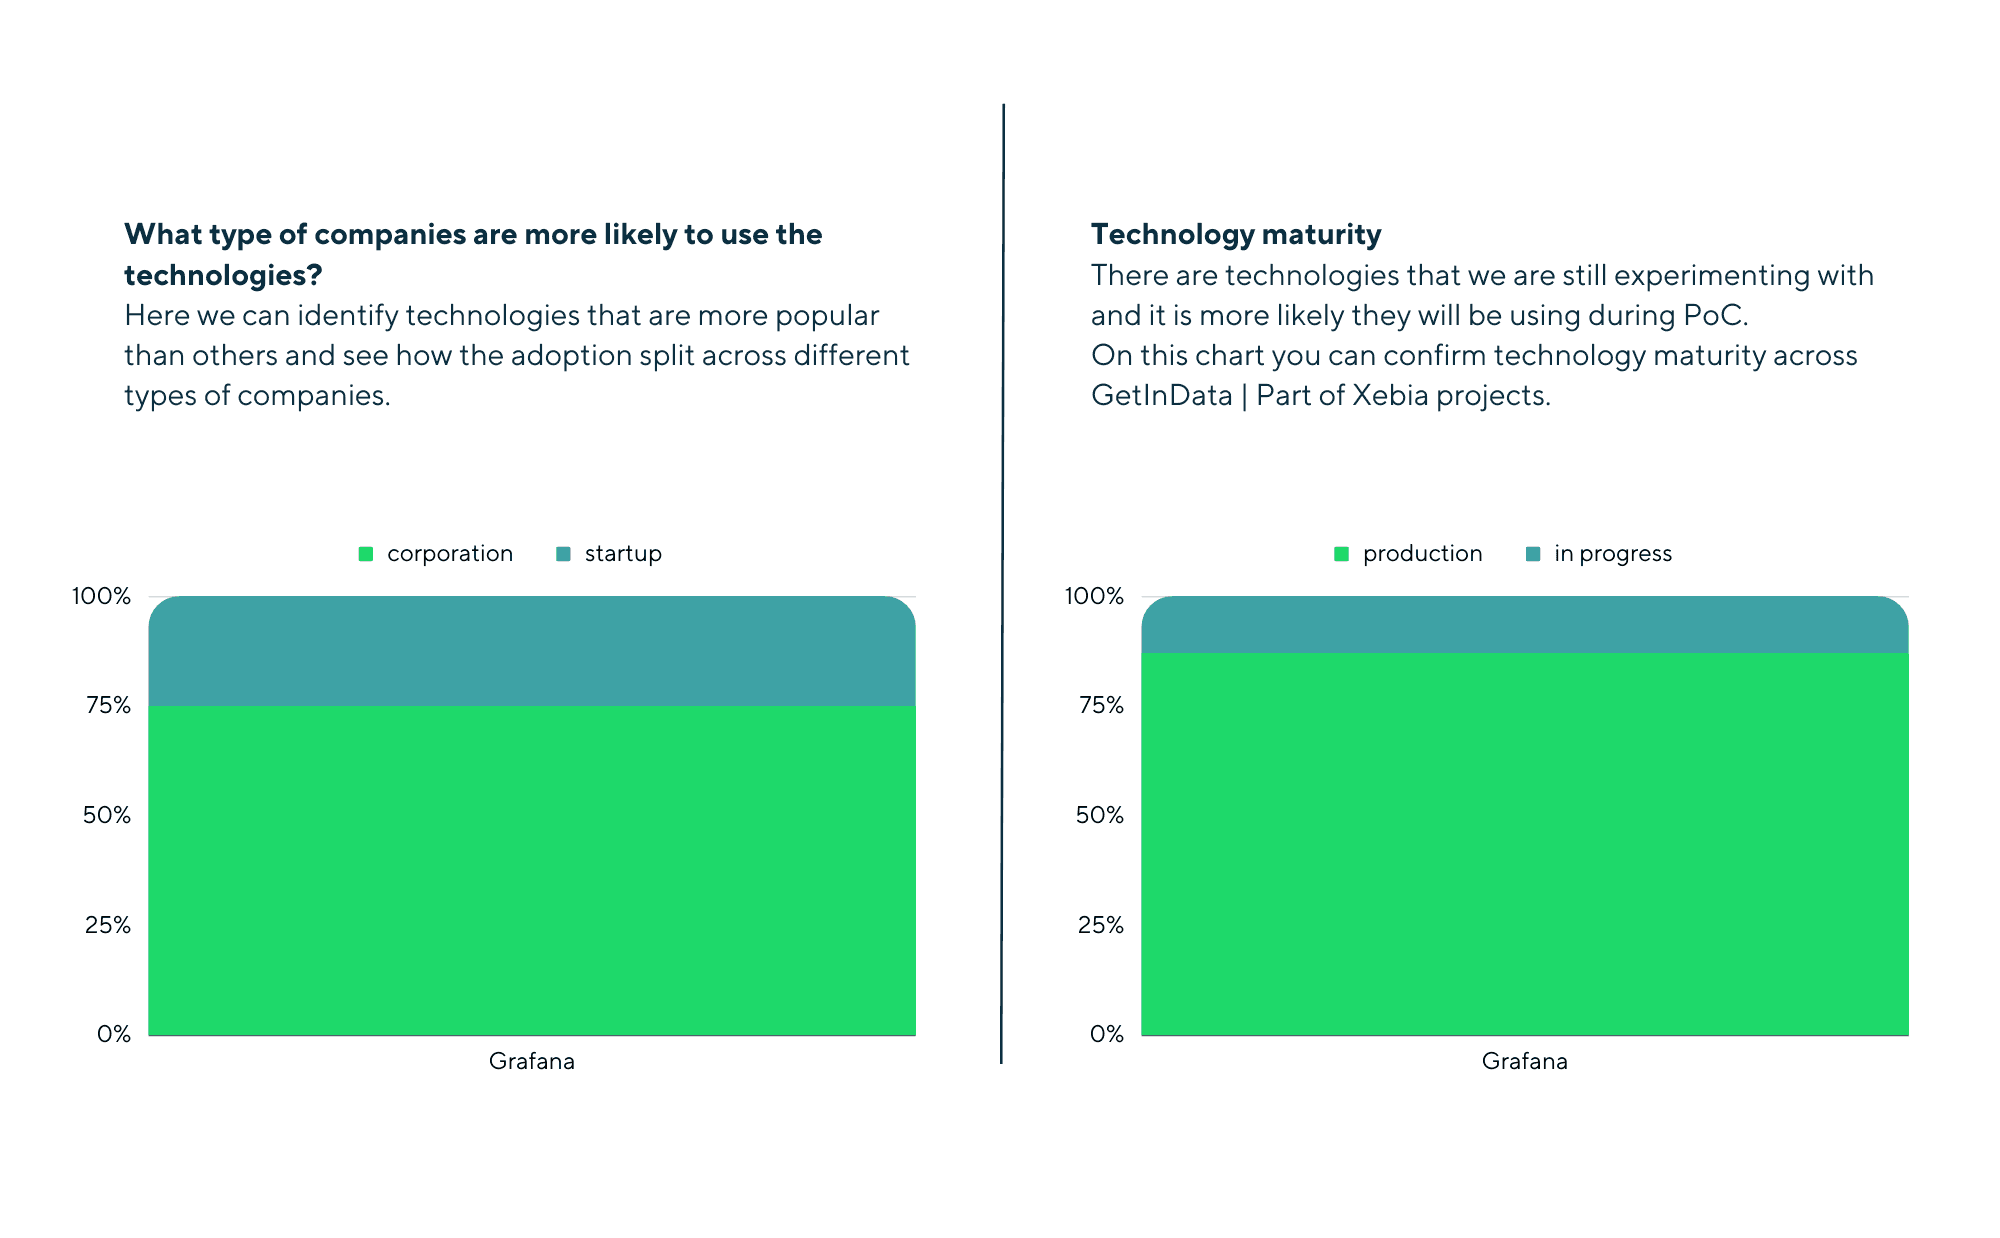
The Grafana users community is one of the largest out there for a reason:
- it provides single pane of glass for metrics, logs, tracing andalerts
- it supports all major data sources and of course, you can add custom ones
- it supports all major federated user authentication standards
- it can be easily deployed in a variety of configurations
Operation
How should you operate and/or upgrade your monitoring solution correctly?
✅ Configuration changes should be verified and applied automatically
Making your configuration changes a part of your CI/CD pipeline is highly recommended.
Tasks to consider for your CI/CD pipeline are:
- static code analysis
- automatic documentation
- security vulnerabilities scanning for container images
- cloud cost changes before deployment
- automatic deployment after successful verification
This way you can focus on the real value of your changes instead of wasting time on manual verification and applying your code.
✅ Storage class with ReadWriteMany access mode (RWX) highly recommended
For example, Grafana publishes a new minor version every two weeks.
Having the possibility to continuously upgrade your apps without downtime is crucial.
In the kubernetes world, the storage class access mode heavily impacts this upgrade process.
As the name ReadWriteMany suggests: it supports read and write capabilities for multiple clients at the same time.
And this is exactly what will be needed during the rolling upgrade of your Grafana pods with previous and new versions: the ability to write to the same volume at the same time.
Another use case where storage class with ReadWriteMany capabilities is recommended is during kubernetes node failure. When this happens, kubernetes will try to reschedule your Grafana pod to another node together with the corresponding persistent volume.
Unfortunately, for storage classes without the RWX capability, your Grafana pod won’t be able to start as kubernetes will still see its persistent volume as being used.
✅ Selinux for persistent volumes is available since k8s v1.24
Selinux is a security enhancement available by default on RedHat family distributions.
It increases the overall system security by decreasing the probability of a single operating system getting compromised.
Because of that, the combination of running your kubernetes workloads on premise, together with Selinux enabled is still a common scenario for high security institutions like banking or government institutions.
While using kubernetes, Selinux installed on your nodes is also used in pods and persistent volumes. Unfortunately, a quite recent version of kubernetes is required in order to fully support Selinux for persistent volumes: v1.24 or higher.
✅ Grafana dashboards maintained by the code
Imagine your Grafana for all prometheus instances you deployed over all those years. Do you remember all the tiny configuration changes you made to quickly fix something?
Of course not!
The solution is simple: include Grafana dashboards configuration in your CI/CD pipeline:
- disable manual Grafana dashboard configuration changes
- lint, test and verify your Grafana dashboard changes automatically before applying
- enjoy your infrastructure synchronized with your code
Performance
How should you optimize your monitoring solution?
✅ Storage performance is the key
Storage is crucial to overall system performance.
Even the best applications won’t perform while running on slow storage.
In the kubernetes world, the above statement still applies: each application pod using persistent volume will reflect the performance of the storage class configured underneath.
Surprisingly, using faster volumes doesn’t mean higher costs.
Many cloud providers offer attractive prices for faster storage, making it an easy choice from both cost and performance points of view.
For example, in AWS, you can reduce your storage costs up to 50% by simply migrating from slower General Purpose 2 (gp2) to new General Purpose 3 (gp3) SSD volume type.
Summary
In this post I have shared our experience with you in running observability stacks on k8s.
I hope you found it useful.
If you want to know more about our observability stack, please check the following blog post where I described its architecture in more detail: Running observability stack on Kubernetes.

