GetInData in 2021 - let’s celebrate our achievements in the Big Data world!
The year 2021 passed in the blink of an eye and the time has come to summarize our goals at GetinData and define our challenges for the next year…
Read moreHow to minimize data processing latency to hundreds of milliseconds when dealing with 100 mln messages per hour? How can data quality be secure and the infrastructure costs optimized? Why was Apache Flink a main technology chosen when designing the streaming analytics system architecture? Check how we built the streaming platform that delivers real-time market data and allows users to easily and quickly respond to data issues.
Cloudwall is a risk platform technology provider for digital assets based in NYC and Singapore. The flagship product, Serenity, is a cloud-based portfolio risk platform for digital asset hedge funds, prop trading firms, OTC desks and anyone managing a diverse portfolio of digital assets.
Cloudwall built a platform for digital asset risk and analytics. The product is dedicated for institutional investors and is designed to help them make decisions based on their portfolios and market events. The client wanted to process market data feeds for token trades & prices, both spot and derivatives instruments in real-time. What they didn’t want to do was to integrate directly with crypto exchanges due to complexity and time to market, so they decided to use different trade data providers.
The challenge we faced in this project was that the client didn’t have control over the quality of the data and problems occurred when there was no data or they were not full because of some issue with the providers.
To meet the client’s expectations, we needed to build a real-time platform with low latency that would be able to handle around 100 mln messages per hour and allow them to quickly react to the data issues. One of the important requirements was that the client also wanted to reduce cloud costs as much as possible.
In the first phase of the project we designed and implemented the streaming platform architecture. The main functionality of the platform was to collect, enhance and unify data from the providers, store them in Kafka and recalculate them to the fair prices.
The solution was designed to deliver the values such as:
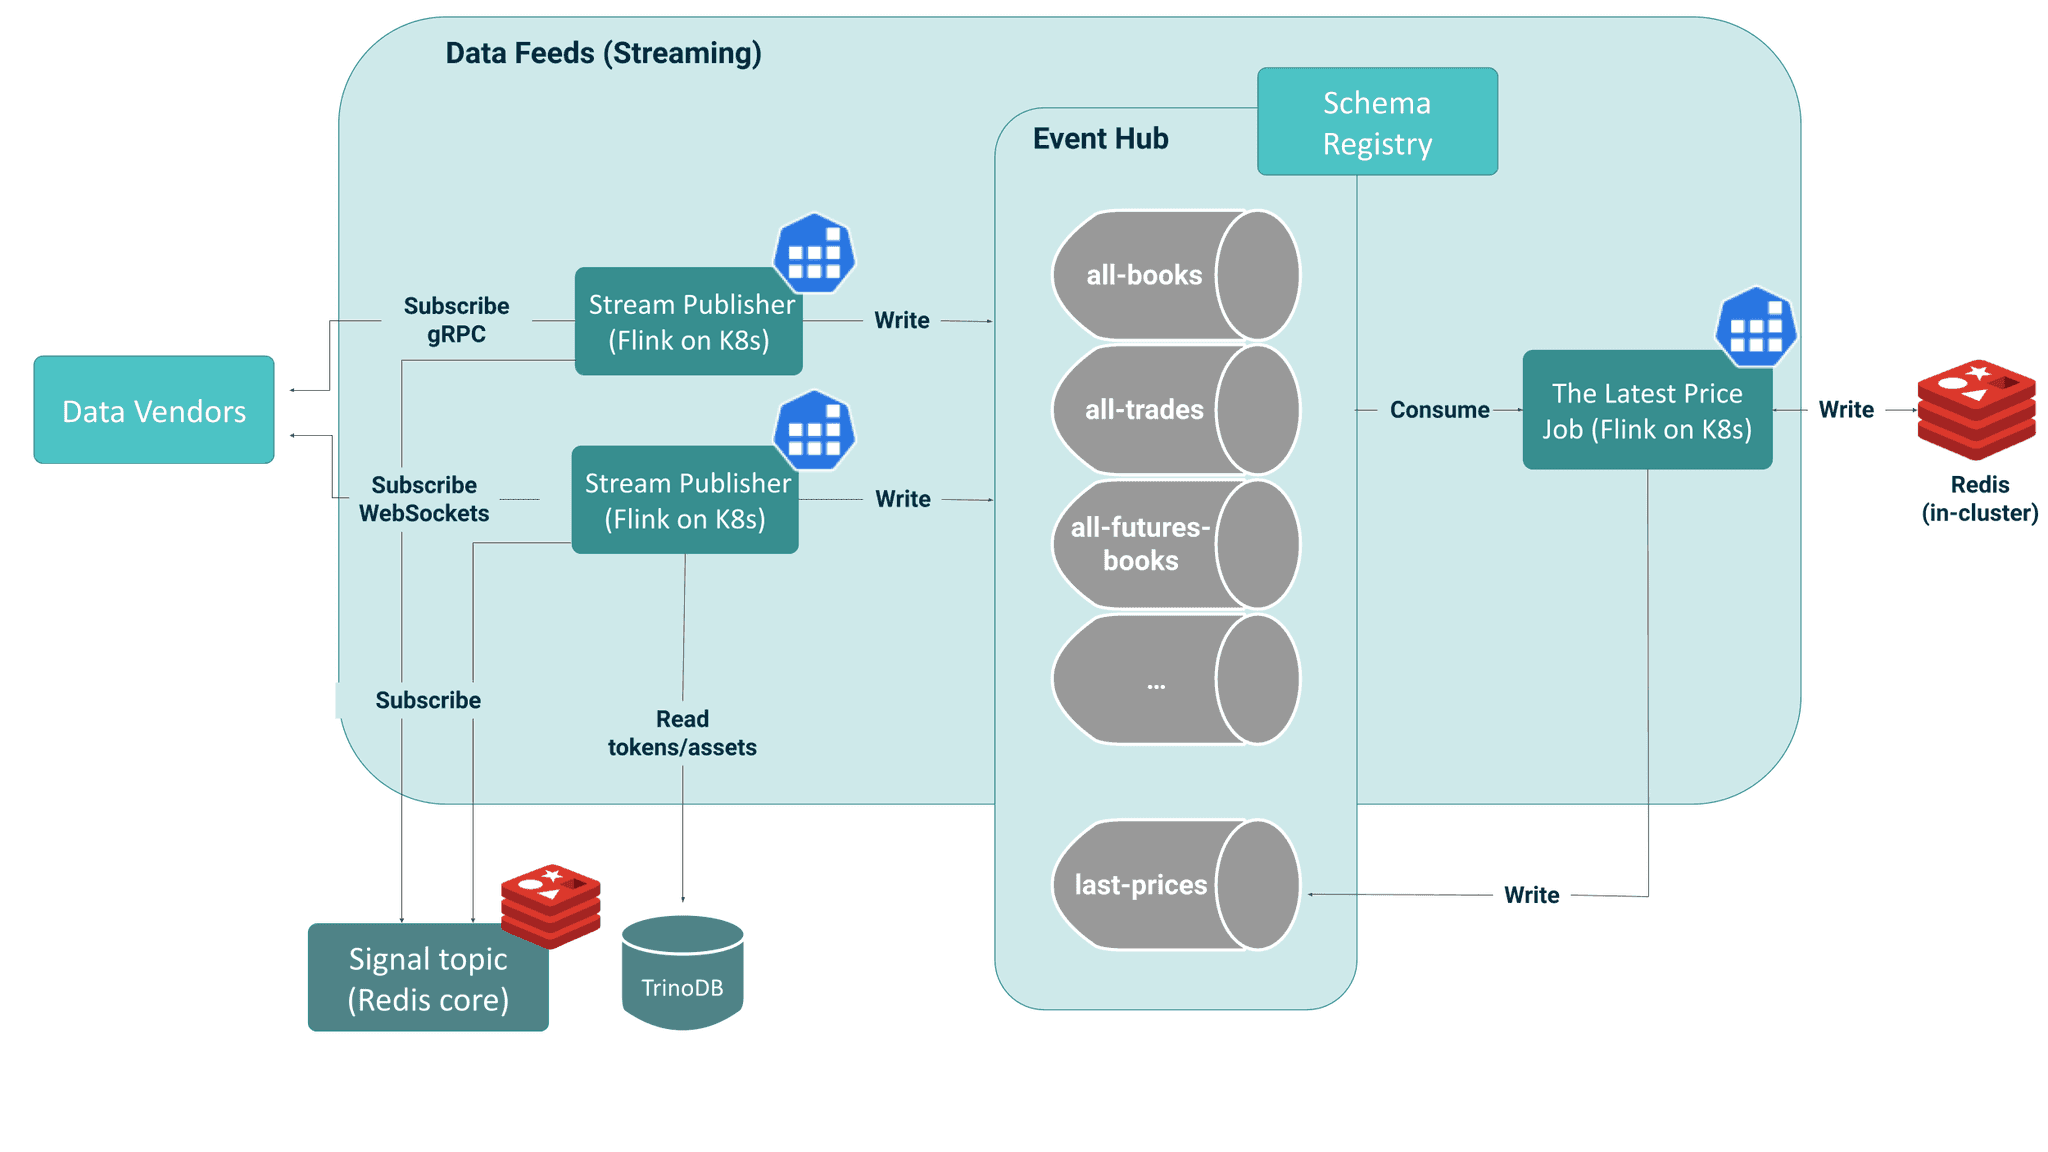
The solution looks like this:

The streaming platform we have built is based on the Apache Flink solution. One of the main roles of the platform is the integration with data providers. This integration is available thanks to the different protocols such as gRPC and WebSockets.
When building the architecture, we implemented the Flink source. Subscriptions have been efficiently partitioned, enabling simultaneous message consumption.
One of features of the system is the dynamic reconfiguration of subscriptions during job execution, allowing for flexible adaptation to changing conditions.
We optimized the performance of serialization and deserialization operations by converting them to an internal message format based on Flink Tuple. This unified format contributes to the reusability of functions, thereby enhancing code quality and facilitating code maintenance.
The orchestration and deployment of jobs have been implemented using the Flink Kubernetes Operator. This operator enables the management of both stateful and stateless jobs, as well as collaboration with the latest versions of Flink.
Additionally, the utilization of the Prometheus Operator for pulling metrics from Flink, along with built-in support for the Prometheus Reporter, ensures effective analysis and monitoring of the system's performance. Ultimately, the layer for visualizing metrics and detecting anomalies has been realized using Grafana, creating a comprehensive environment for managing and monitoring the Flink-based architecture.
GetinData has offered Cloudwall the streaming monitoring system based on Flink to address data-related issues. The monitoring system presents the current state of the system with all important metrics - both technical and business ones. Flink provides technical metrics, including processed record count, data volume, job up-time, restart count, memory usage, and more. Additionally, functions can provide supplementary information, such as Kafka sink measuring the number of executed transactions, errors, retries, and others.
In this case data monitoring required adding business metrics that were dynamically labeled (metric groups in Flink). This allowed us to monitor data with different data granularities, such as the throughput of messages related to a single instrument, an entire class of data types on the exchange, or the entire exchange itself. Utilizing monitoring based on unified metrics enabled comparative monitoring of providers and automated detection of data anomalies.
The metrics we monitor are collected in the Prometheus database and are available for visualization and monitoring in Grafana. What is also important, metrics created with dynamic labels enable various functionalities, including:
The Streaming Monitoring System we have created allows users to analyze and monitor the data without requiring high-level knowledge of cryptocurrency. We can react to events such as no data from the market or a significant difference in prices in real time.
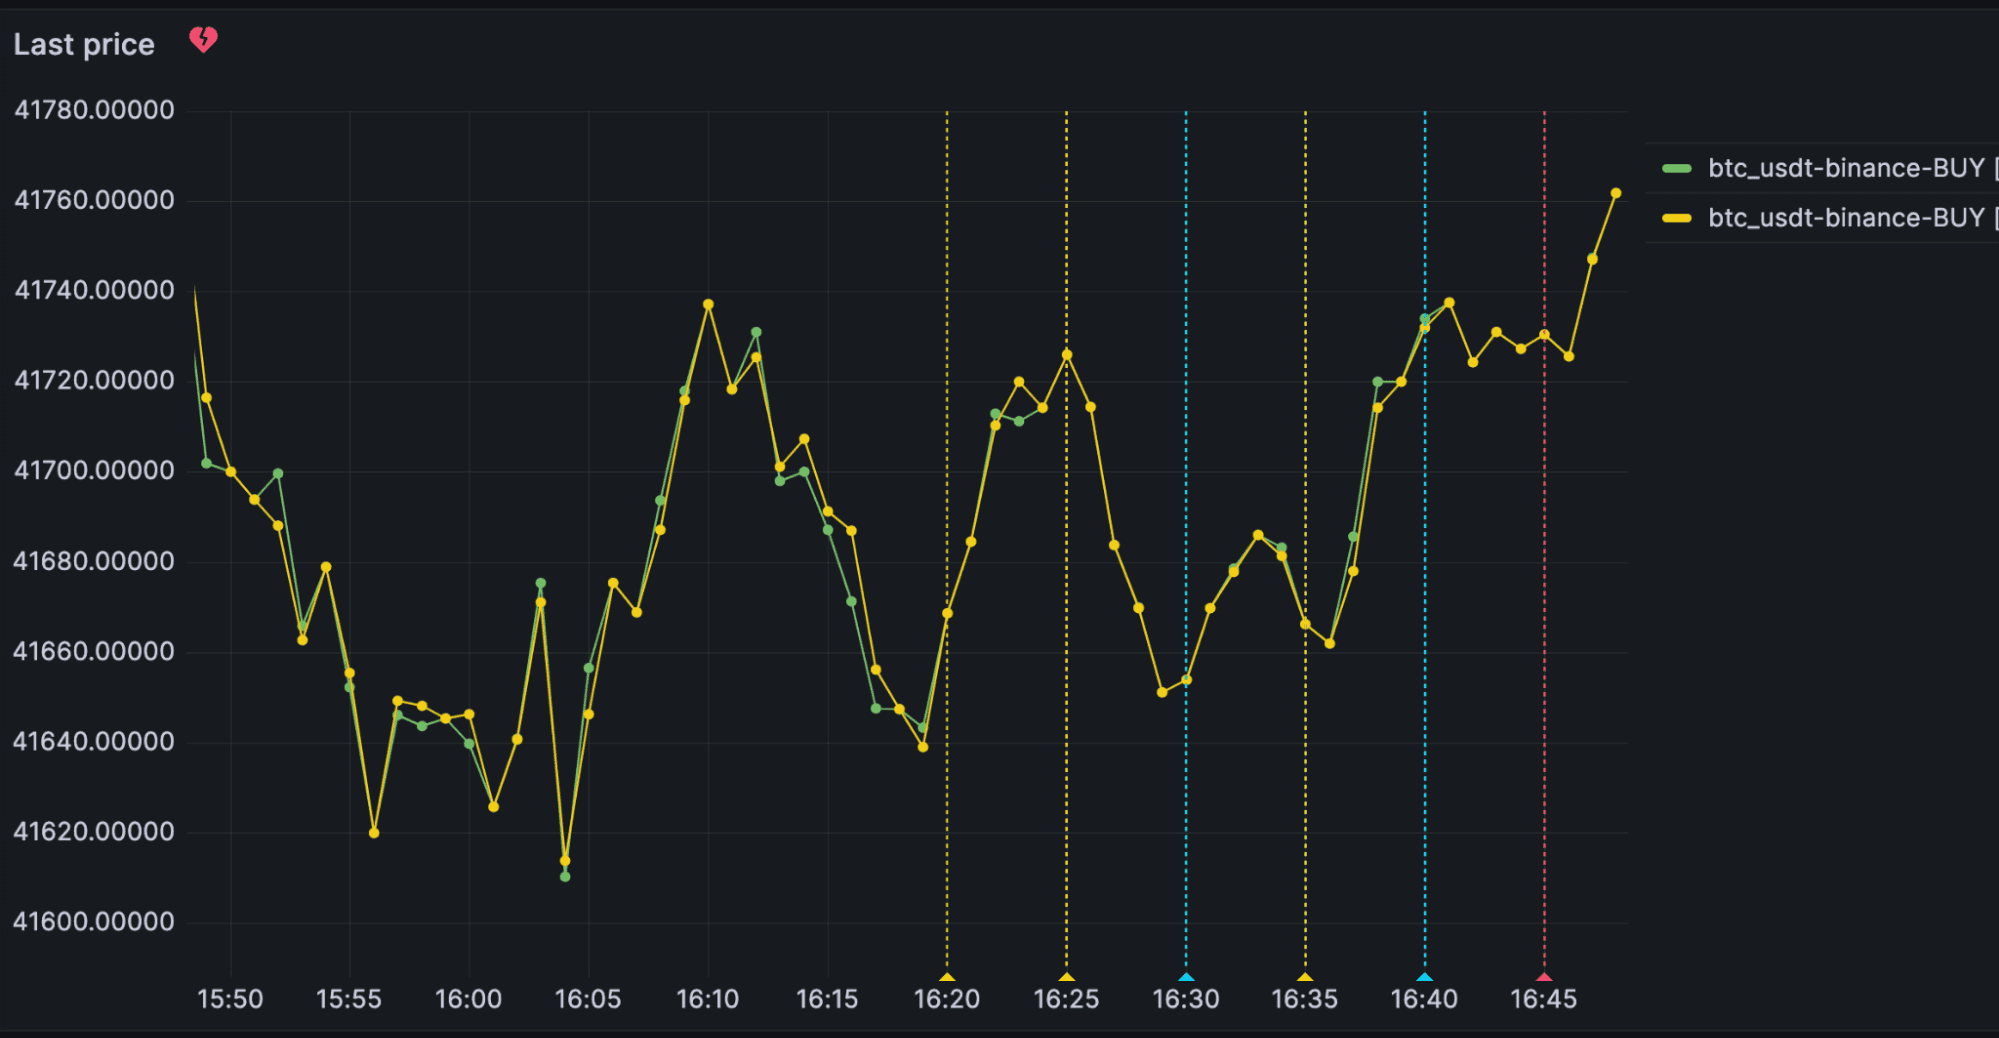
The Streaming Monitoring System allows us to monitor price based on the metrics. Below you can see the prices from the suppliers, which are quite similar. The charts show minor discrepancies, which may result from low metric resolution, delivery delays, or data processing.

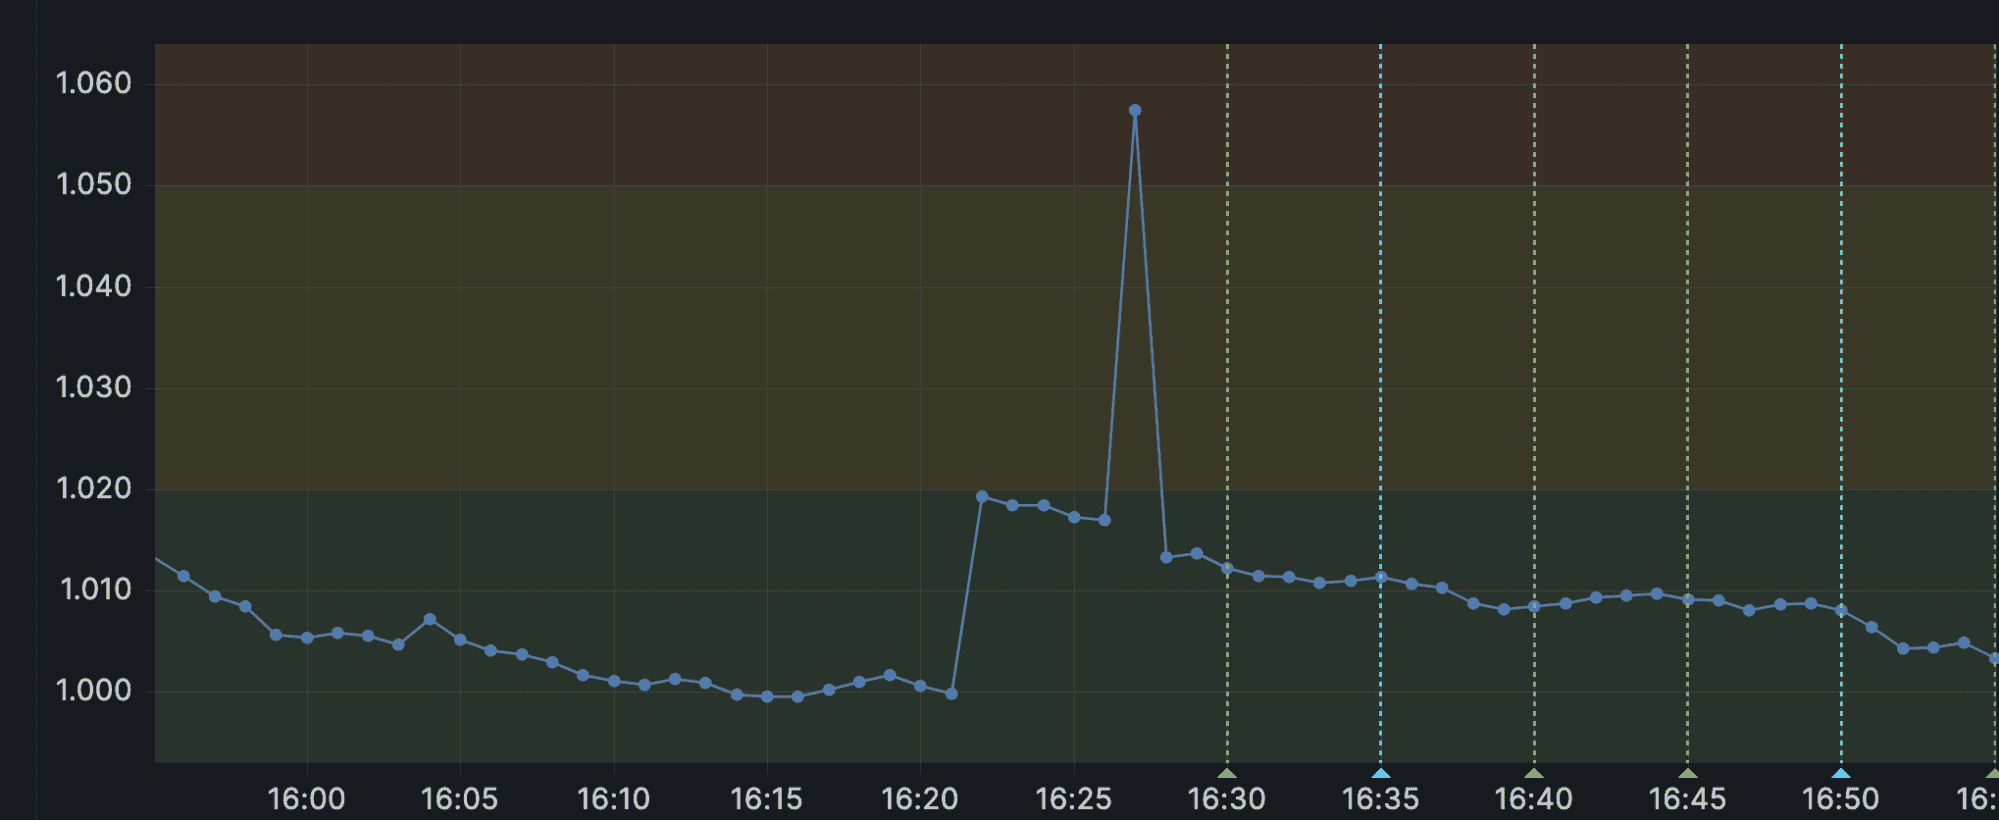
When we go to the Price ratio, we are able to see a single discrepancy reaching approximately to a 6% difference in price. In the picture below you can see the peak extending beyond the green line. In this case, it is not an alarming situation. Maintaining such a discrepancy over an extended period would indicate a difference in prices between suppliers. A single change could result from factors such as data processing delays by suppliers or relatively low metric refresh rates (several tens of seconds).

This use-case shows that monitoring only one aspect, for example, the instrument's price, does not provide a complete picture of potential issues. For this reason, it is necessary to expose multiple metrics, including data latency, refresh frequencies (market update rate), a summary of active subscriptions, and more. Building a comprehensive system has enabled, among other things, the detection of data errors or gaps (at the instrument level, data class level, or across the entire exchange).
In the case of the infrastructure capabilities, the most important factor wasn’t the volume of data it could process but the cost it generated. We developed a fully scalable streaming platform, but we had to take care of the cost. We optimized the platform’s cost through three key elements:

The project aimed to build an architecture that would provide greater control and faster response to changes or anomalies in incoming data. As a result, the solution we created:
Do you want to build a Streaming Analytics Platform? Do not hesitate to contact us or sign up for a free consultation to discuss your data streaming needs.
The year 2021 passed in the blink of an eye and the time has come to summarize our goals at GetinData and define our challenges for the next year…
Read moreWelcome back to our comprehensive coverage of InfoShare 2024! If you missed our first part, click here to catch up on demystifying AI buzzwords and…
Read moreApache Sedona is a distributed system which gives you the possibility to load, process, transform and analyze huge amounts of geospatial data across…
Read moreAbout the GetInData Modern Data Platform In our previous article you learned what our take on the Modern Data Platform is and that we took some steps…
Read moreBig Data Technology Warsaw Summit 2021 is fast approaching. Please save the date - February 25th, 2021. This time the conference will be organized as…
Read moreWe are excited to announce that we recently hit the 1,000+ followers on our profile on Linkedin. We would like to send a special THANK YOU :) to…
Read moreTogether, we will select the best Big Data solutions for your organization and build a project that will have a real impact on your organization.
What did you find most impressive about GetInData?