Highly available Airflow cluster in Amazon AWS
These days, companies getting into Big Data are granted to compose their set of technologies from a huge variety of available solutions. Even though…
Read moreNowadays, companies need to deal with the processing of data collected in the organization data lake. As a result, data pipelines are becoming more and more complicated, which significantly impacts the development speed lifecycle. Moreover, sometimes ETL pipelines require knowledge from the software development area, e.g. when you want to build your pipelines using Apache Beam. Today, I would like to show you a new tool called dbt, which can help you tame your massive data and simplify building complex data pipelines.
Dbt allows us to build ELT pipelines, which are a bit different from classic ETL pipelines. Let's compare these two approaches:
Dbt opens new opportunities for your data engineering team and allows ELT pipelines to be built, even by someone who has little experience with SQL.
In this article, I would like to show you how to build a simple data pipeline step-by-step with dbt and BigQuery.
We are going to build a simple data model, which processes data from Google Analytics. The dataset is one of the open datasets offered by BigQuery.
In my opinion, the easiest way to start your adventure with dbt and BigQuery is to customize a sample project generated by dbt CLI. Before we start, I'm going to assume you have an empty GCP project. In this example, I am using a project with the name 'dbt-bq-playground' .
So let's start with setting up the development environment. First, open 'Cloud Shell' from the GCP dashboard and run the following command:
pip3 install --user --upgrade dbt-bigquery

When the command finishes, you will have dbt CLI available in the command line. We can use the CLI to generate a sample project. Let's assume the project has the name 'sample_dbt_project' . To generate project structure, please run the following command in the cloud shell:
~/.local/bin/dbt init sample_dbt_project
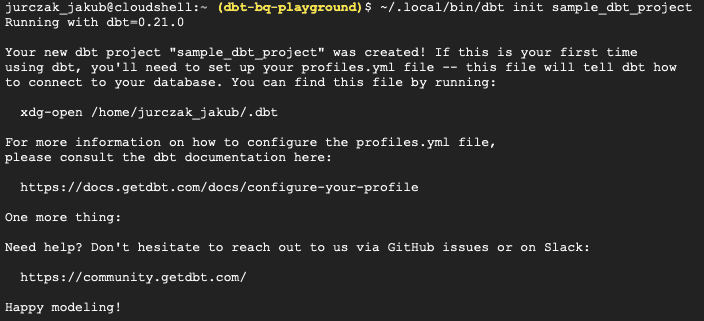
The CLI should generate the project structure in a "~/sample_dbt_project" directory. Before running our first pipeline, we need to create a dataset in BigQuery and set up the dbt configuration.
Please select 'BigQuery' from the navigation menu and click the 'create dataset' button to create a dataset.

In the dataset edit window, you need to fill in the dataset name (in our case "dbt-bq-playground-ds') and click the 'create dataset' button.
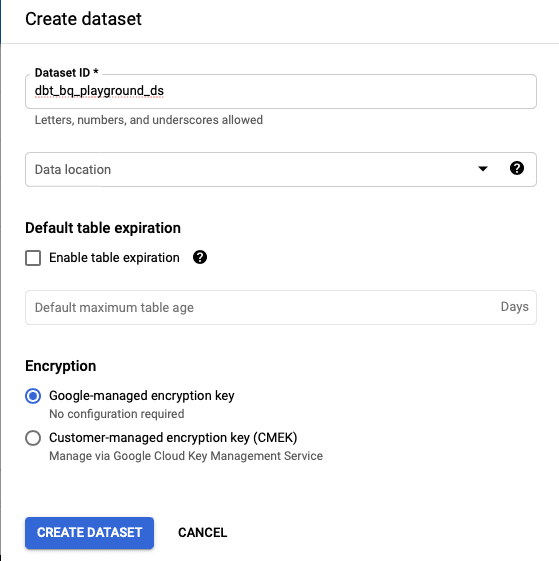
When the dataset has been created, we are ready to fill in the dbt profile.yml file, which contains the dbt configuration. To do this, please edit:
nano ~/.dbt/profiles.yml
It should look like this:
default:
  outputs:

    dev:
      type: bigquery
     method: oauth
      project: <YOUR_PROJECT_ID>
      dataset: dbt_bq_playground_ds
      threads: 1
      timeout_seconds: 300
      location: US # Optional, one of US or EU
      priority: interactive
      retries: 1

    prod:
      type: bigquery
      method: service-account
      project: [GCP project id]
      dataset: [the name of your dbt dataset]
      threads: [1 or more]
      keyfile: [/path/to/bigquery/keyfile.json]
      timeout_seconds: 300
      priority: interactive
      retries: 1

  target: dev
In most cases, dev and prod environments are shared. Transformations on these environments should only be run by the CI/CD process. If you want to test your transformations locally, you can parametrize the result dataset as below:
dataset: "{{ env_var('USER') }}_private_working_schema"
Next, you can save & exit, by pressing CTRL + S, CTRL + X. Now we are ready to run the example pipeline. To do this, please run the following in the dbt project directory:
~/.local/bin/dbt run

If everything goes smoothly, you should see the results in the BigQuery console.
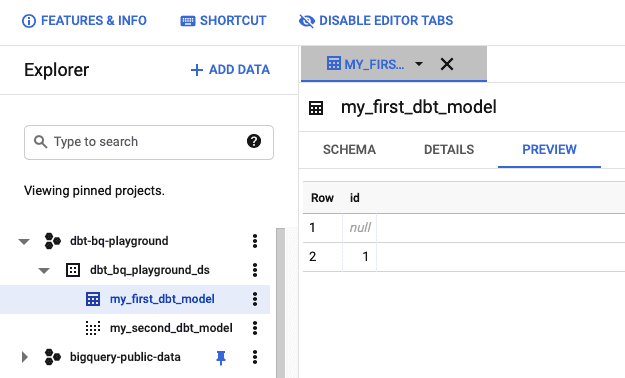
Now we are ready to start editing the dbt project files. In the example, I am going to use 'Cloud Shell Editor' provided by GCP. Please click the 'Open Editor, button to open the editor.

Please click' File → Open' in the editor window and select 'sample_dbt_project'in the home directory. Finally, you should see an editor window as below:
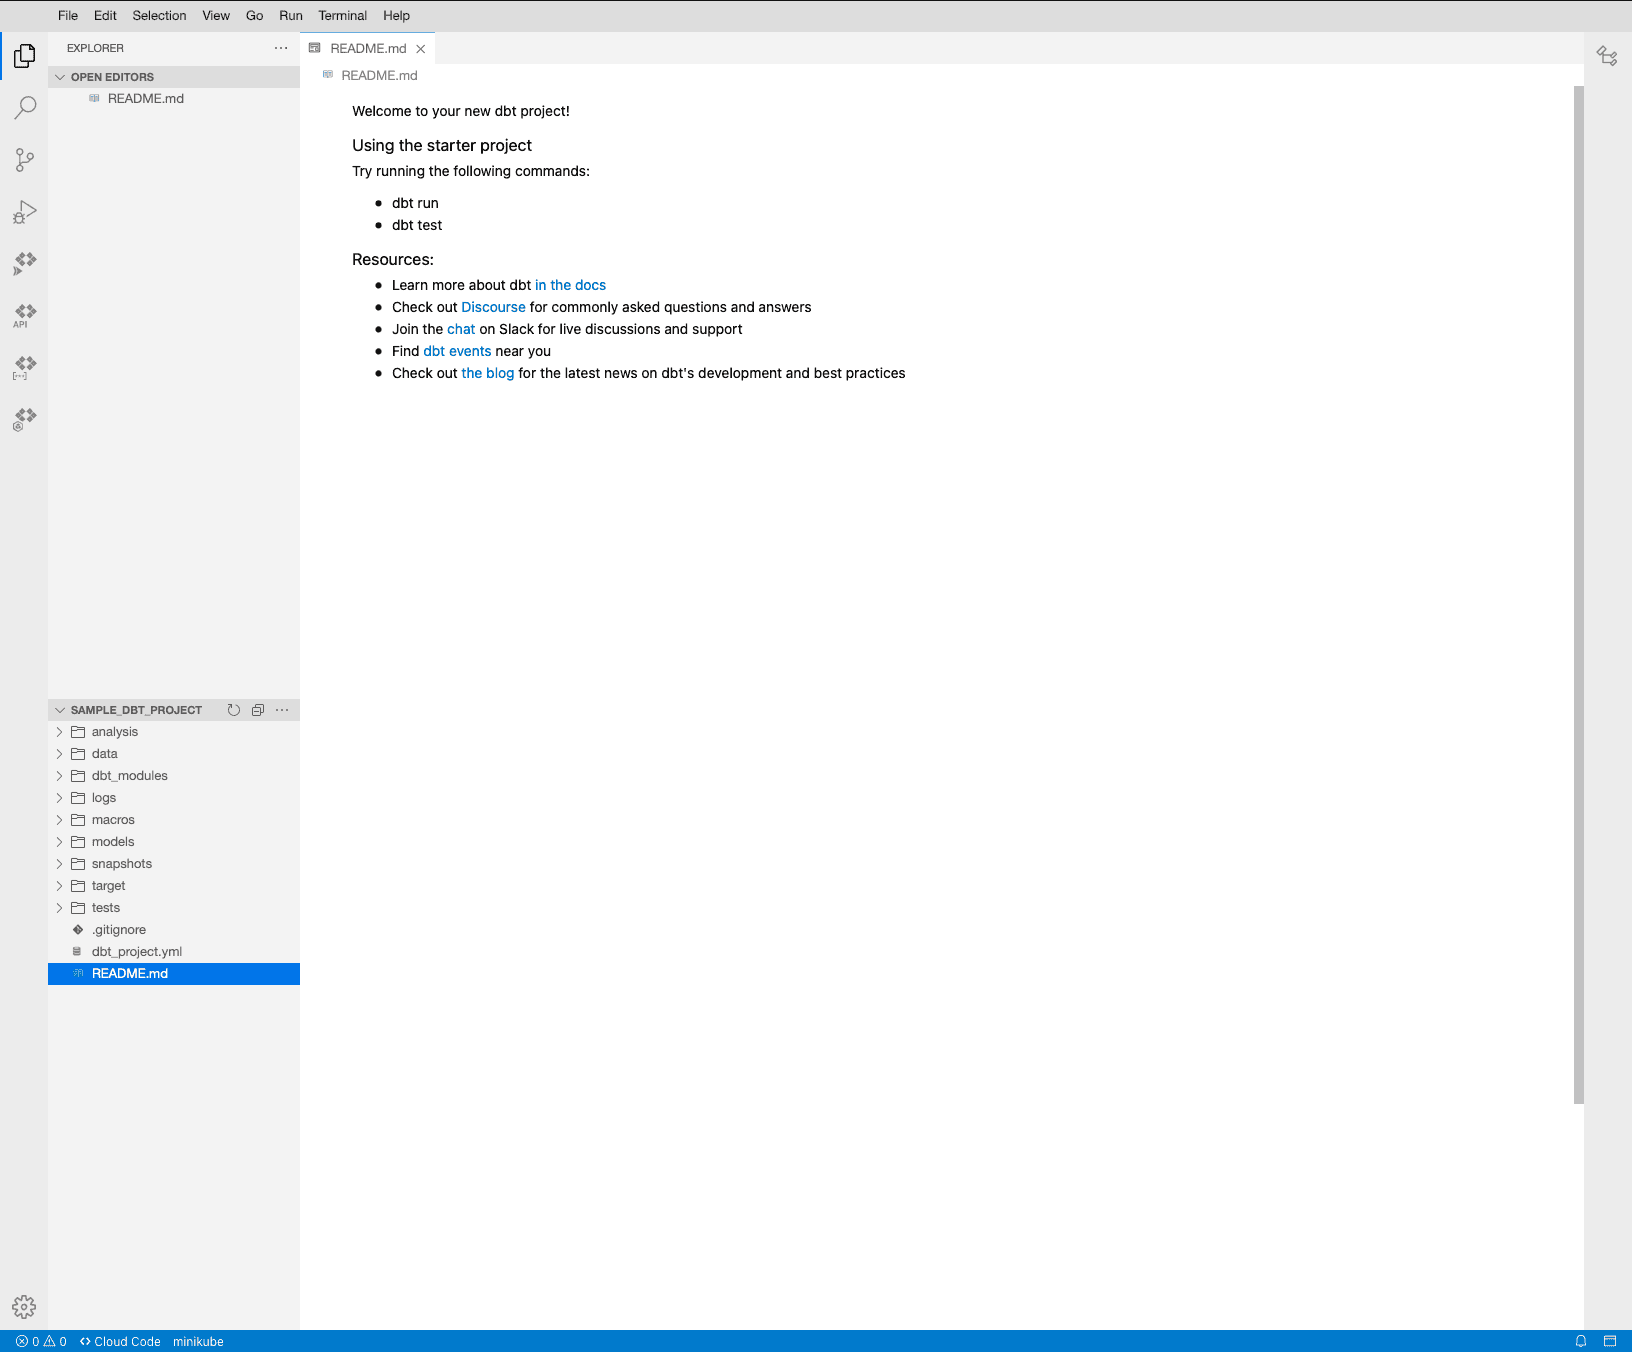
We've generated a sample project by using dbt CLI. Before we start building our custom pipelines, I would like to describe the dbt project structure briefly.
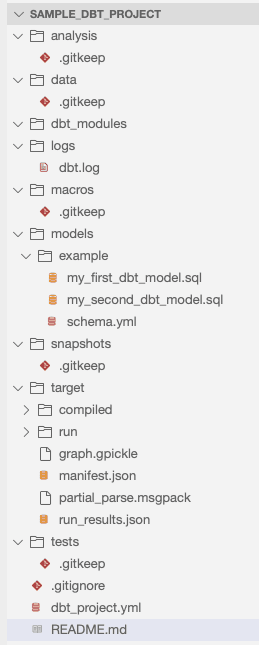
dbt seed command.dbt deps command.dbt run commandtarget/and dbt_modules/folders can be deleted by running dbt clean.Now we are ready to analyze how does the example pipeline work. We start our journey from the models/example folder. In the folder, you can see *.sql files and schema.yml. In *.sql files, we have a definition of our models. Let's open the my_first_dbt_model.sql.
/*
    Welcome to your first dbt model!
    Did you know that you can also configure models directly within SQL files?
    This will override configurations stated in dbt_project.yml

    Try changing "table" to "view" below
*/

{{ config(materialized='table') }}

with source_data as (

    select 1 as id
    union all
    select null as id

)

select *
from source_data

/*
    Uncomment the line below to remove records with null `id` values
*/

-- where id is not null
This file contains a definition of a dbt transformation. At the beginning, we defined that we wanted to materialize the transformation as a table. In the dbt, we have a few options to choose from as to how the transformation should materialize:
So what are the best practices to use for each of them?
Next, we can see the with keyword. In this section, we can define temporary tables, which will be used in the final SQL query.
At the end of the file, we defined the SQL query, which describes our transformation.
Now, we are ready to use the model defined in the previous example. Please open the my_second_db_model.sql file. The file contains an example view definition, which refers to the previous model.
-- Use the `ref` function to select from other models

select *
from {{ ref('my_first_dbt_model') }}
where id = 1
In the example, we can see the use of a ref function. This function allows us to reference one model within another. It opens new opportunities for us to build data pipelines from a small, reusable code block that is easy to understand and test.
Dbt offers auto-generation of project documentation. The schema documentation exists in the schema.yml file and should contain all model descriptions, as in the example below:
version: 2

models:
  - name: my_first_dbt_model
    description: "A starter dbt model"
    columns:
      - name: id
        description: "The primary key for this table"
        tests:
          - unique
          - not_null

  - name: my_second_dbt_model
    description: "A starter dbt model"
    columns:
      - name: id
        description: "The primary key for this table"
        tests:
          - unique
          - not_null
In the schema definition, you can add a description for each model or column, which will be used to generate the project documentation. Later in the blog post we'll see how to create interactive documentation from our transformations.
Now we are ready to define our first custom data pipeline, which will process data from one of the BigQuery open datasets. But first, let's see how to do it.
We will work with a simple scenario, which requires creating 2 tables and 1 view in the dbt. First, let's see the description:
As a Data Engineer, I would like to prepare a report about user activities based on data from Google Analytics. Therefore, I expect the following tables to be created:
Before we start, please delete the example/ and create the users_report/ folder in the model/ directory.
Now we can start building our data pipelines. Please create files in the users_report/ folder as below:

distinct_country_count.sql should contain a query, which adds up the unique countries of our users.
{{ config(materialized='table') }}

SELECT
    date AS reportDate,
    device.operatingSystem AS operationSystem,
    COUNT(DISTINCT geoNetwork.country) AS distincCountCountry,
FROM `bigquery-public-data.google_analytics_sample.ga_sessions_20170801`
GROUP BY date, device.operatingSystem
total_page_views.sql should contain a query, which adds up the total views of our users.
{{ config(materialized='table') }}

SELECT
    date AS reportDate,
    device.operatingSystem AS operationSystem,
    SUM(totals.pageviews) AS totalPageViews,
FROM `bigquery-public-data.google_analytics_sample.ga_sessions_20170801`
GROUP BY date, device.operatingSystem
users_report.sql should contain a query, which generates the final report.
{{ config(materialized='view') }}

SELECT
    c.reportDate,
    c.operationSystem,
    c.distincCountCountry,
    t.totalPageViews
FROM {{ ref('distinct_country_count') }} AS c
JOIN {{ ref('total_page_views') }} AS t
ON c.reportDate = t.reportDate AND c.operationSystem = t.operationSystem
Finally, we need to create the schema.yml file, which contains information about our models.
version: 2

models:
  - name: distinct_country_count
    description: "Contains information about unique countries"
    columns:
      - name: reportDate
        description: "A day when the statistics have been generated"
      - name: operationSystem
        description: "A user operating system"
      - name: distincCountCountry
        description: "Distinct country count"

  - name: total_page_views
    description: "Contains information about total views"
    columns:
      - name: reportDate
        description: "A day when the statistics have been generated"
      - name: operationSystem
        description: "A user operating system"
      - name: totalPageViews
        description: "Distinct country count"

  - name: users_report
    description: "Final report"
    columns:
      - name: reportDate
        description: "A day when the statistics have been generated"
      - name: operationSystem
        description: "A user operating system"
      - name: distincCountCountry
        description: "Distinct country count"
      - name: totalPageViews
        description: "Distinct country count"
At the end, we are ready to run our pipeline and check the results. Please run the ~/.local/bin/dbt run command in the project directory.

When the command has finished, we can check the results in the BigQuery window.
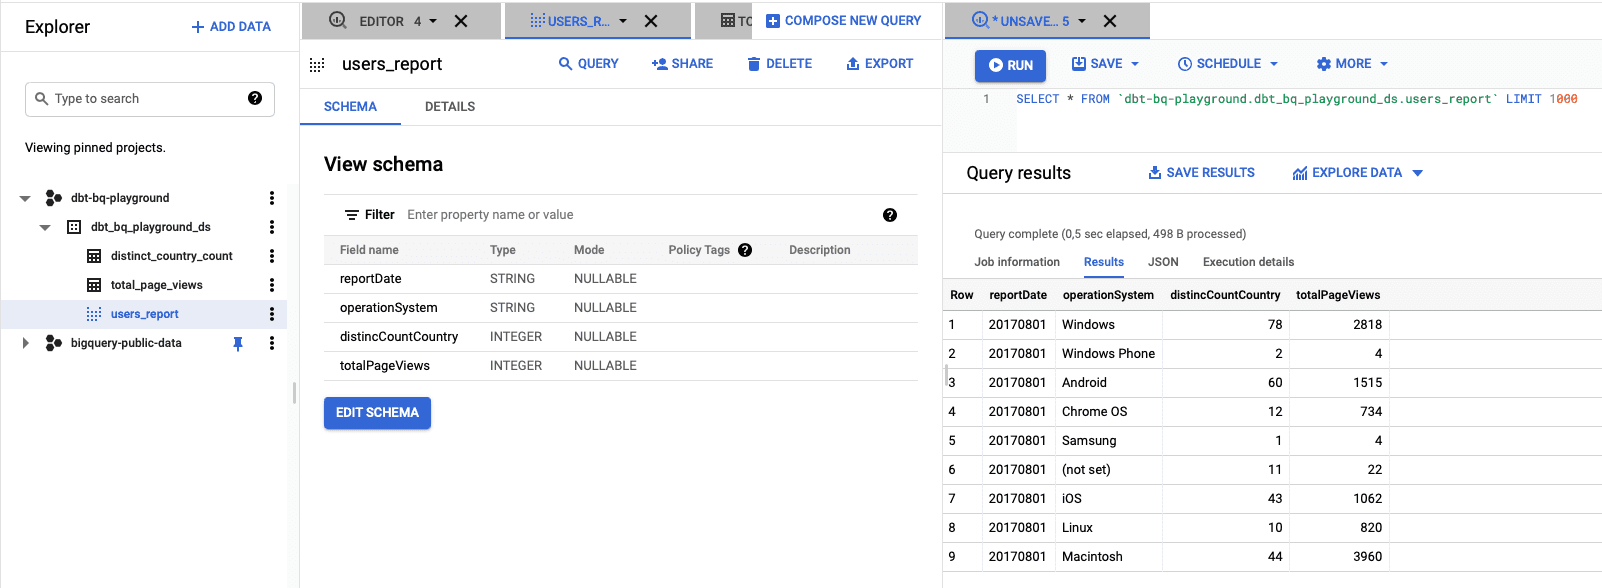
As we can see, we have the final report in the dataset.
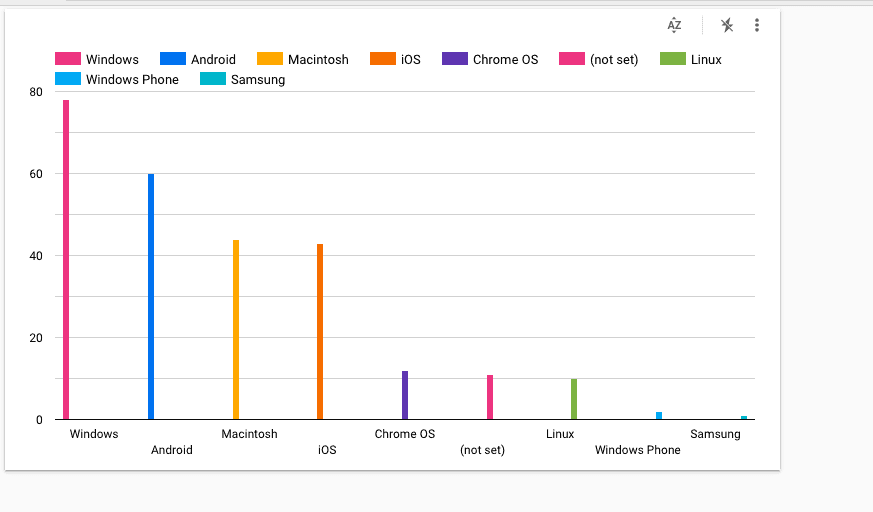
We can generate a Data Studio dashboard based on the data by clicking the "Explore Data" button. You can build a bar chart, which will look like below.
It is good practice to write tests for your code and maintain a high level of test coverage. Dbt provides a simple mechanism, which allows us to write tests for our transformations. A data test in the dbt is just an SQL file stored in the /tests directory, which contains an SQL query. When we run the dbt test command, the dbt will pick up tests from the project, run queries stored in files and check if the query returns 0 rows. If a query returns >0 rows, the dbt treats such assertion as a fail.
Let's write two simple data tests in our project. We want to cover the following scenarios:
Please create two files like below:

In theassert_country_count_is_positive.sql file, we want to write a logic, which checks the correctness of the 'total page views' value.
SELECT
    operationSystem,
    distincCountCountry
FROM {{ ref('distinct_country_count') }}
WHERE distincCountCountry < 0 OR distincCountCountry IS NULL
In the assert_page_views_is_positive.sql file, we want to write a logic, which checks the correctness of the country count value.
SELECT
    operationSystem,
    totalPageViews
FROM {{ ref('total_page_views') }}
WHERE totalPageViews < 0 OR totalPageViews IS NULL
We can run our data tests by calling on ~/.local/bin/dbt test.
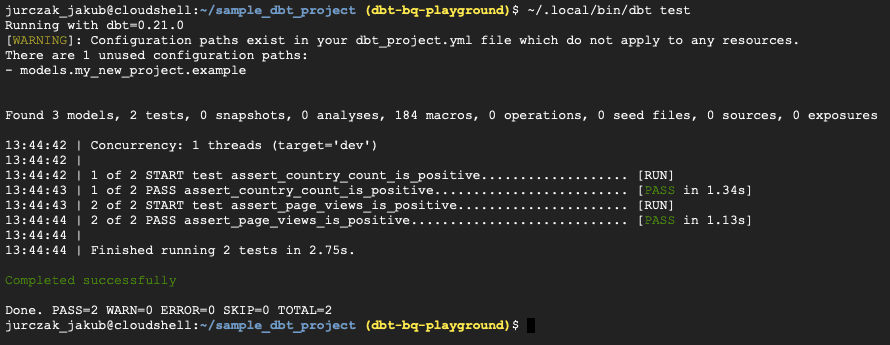
As you see, all assertions pass, so our transformations work as expected.
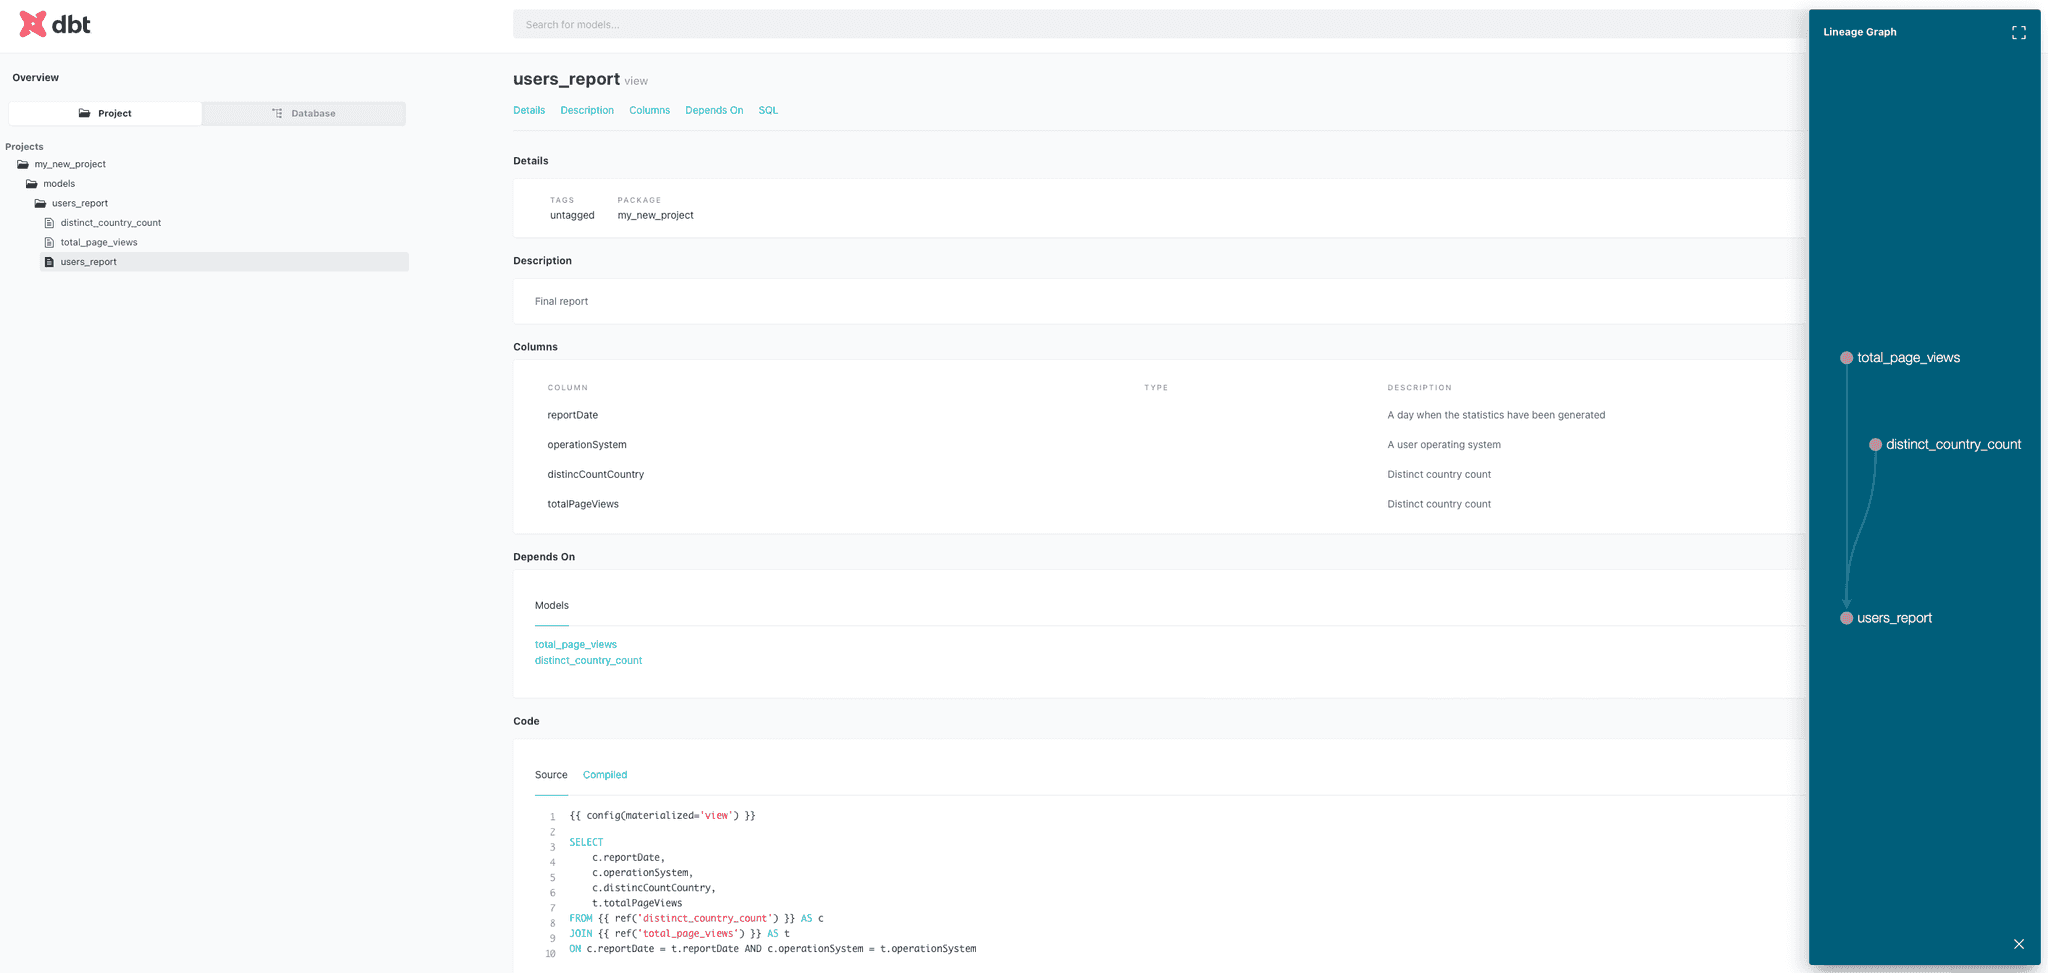
There is one more significant feature of the dbt, which should be mentioned. We can generate and serve the documentation of our data pipelines based on the schema file content. Moreover, the dbt can generate a graph of dependencies from our data pipelines.
To generate the documentation, please run this command ~/.local/bin/dbt docs serve.

The result will be served on the address from the console. So, when you click the address, you should see something like this.
Dbt offers new opportunities for Data Engineers who want to build data pipelines using pure SQL and quickly test their code. The tool helps us manage even very complex data pipelines due to documentation generators, which allow us to visualize the graph of dependencies in the project. The documentation is a good starting point for other teams, which want to start extracting knowledge from company data or build machine learning models. dbt is easy to learn by someone who has experience with the SQL syntax and wants to take their first steps in the data engineering area.
I believe it is a piece of technology that will prove very useful for many companies looking for an ELT framework for their data engineering team. Moreover, dbt would be the best choice for data scientists who know SQL and are looking for a tool which can help them with processing data from many different data sources.
These days, companies getting into Big Data are granted to compose their set of technologies from a huge variety of available solutions. Even though…
Read moreA partnership between iZettle and GetInData originated in the form of a two-day workshop focused on analyzing iZettle’s needs and exploring multiple…
Read moreIn this episode of the RadioData Podcast, Adam Kawa talks with Michał Wróbel about business use cases at RenoFi (a U.S.-based FinTech), the Modern…
Read moreLast month, I had the pleasure of performing at the latest Flink Forward event organized by Ververica in Seattle. Having been a part of the Flink…
Read moreHave you ever searched for something that isn't typical for you? Maybe you were looking for a gift for your grandmother on Amazon or wanted to listen…
Read moreFrom 0 to MLOps with Snowflake ❄️ In the first part of the blogpost, we presented our kedro-snowflake plugin that enables you to run your Kedro…
Read moreTogether, we will select the best Big Data solutions for your organization and build a project that will have a real impact on your organization.
What did you find most impressive about GetInData?